Get All the Data You Need for Your Race
Pre-Built Race Registration Reports Contents
- Pre-Built Race Registration Reports
- 1. Registration Heat Map
- 2. Participant Retention
- 3. Revenue by Category
- 4. Race Year Registration Trends
- 5. Race Year Revenue Trends
- 6. Yearly Totals by Category
- 7. Yearly Revenue by Category
- 8. Registration Question Stats
- Pre-Built Financial Reports for Race Directors
- 1. Financials & Chargebacks
- 2. Direct Deposit Reports
- 3. Forecasting
- 4. Revenue by Type
- 5. Median Order Stats
- Pre-Built Booth Reports
- 1. Booth Heat Map
- 2. Booth Retention
- 3. Revenue by Event Day
- 4. Revenue by Booth Type
- 5. Race Year Booth Trends
- 6. Yearly Totals by Booth Type
- 7. Yearly Totals by Event Day
- 8. Booth Sales Question Stats
- Custom Reports for Race Directors
- 1. Select your graph or report.
- 2. Choose details for your graph or report.
- 3. Check filters in preview.
- 4. Name and save your graph or report.
- 5. View your new graph or report on your graphs page.
Good data makes all the difference in how you make decisions for your race. Whether you need marathon data or 5K fundraising data, Race Entry offers over 20 pre-built reports to ensure you have all the information you need to build a successful race each year.
Beyond our pre-built reports, you can also quickly build custom reports to ensure you’re getting what you need.
Pre-Built Race Registration Reports
Getting people to your race really determines how successful your race is, especially as you continue to build it each year. You need as much information as possible to understand what’s working to get people signed up and where you need to improve.
1. Registration Heat Map
Your registration heat map shows you where your participants come from using their billing zip codes.
With this information, you can strategically place geo-targeted social media ads, place billboards, radio ads, newspaper ads, and even lawn signs. You’ll get more results from your traditional and paid marketing efforts with the insights from your registration heat map.
You’ll also benefit from your heat map because you’ll know how many people are coming from out of town, which can help you negotiate hotel room blocks and deals with local hotels.
2. Participant Retention
As you organize your race each year, you’ll want to understand how many of your participants are coming back year after year.
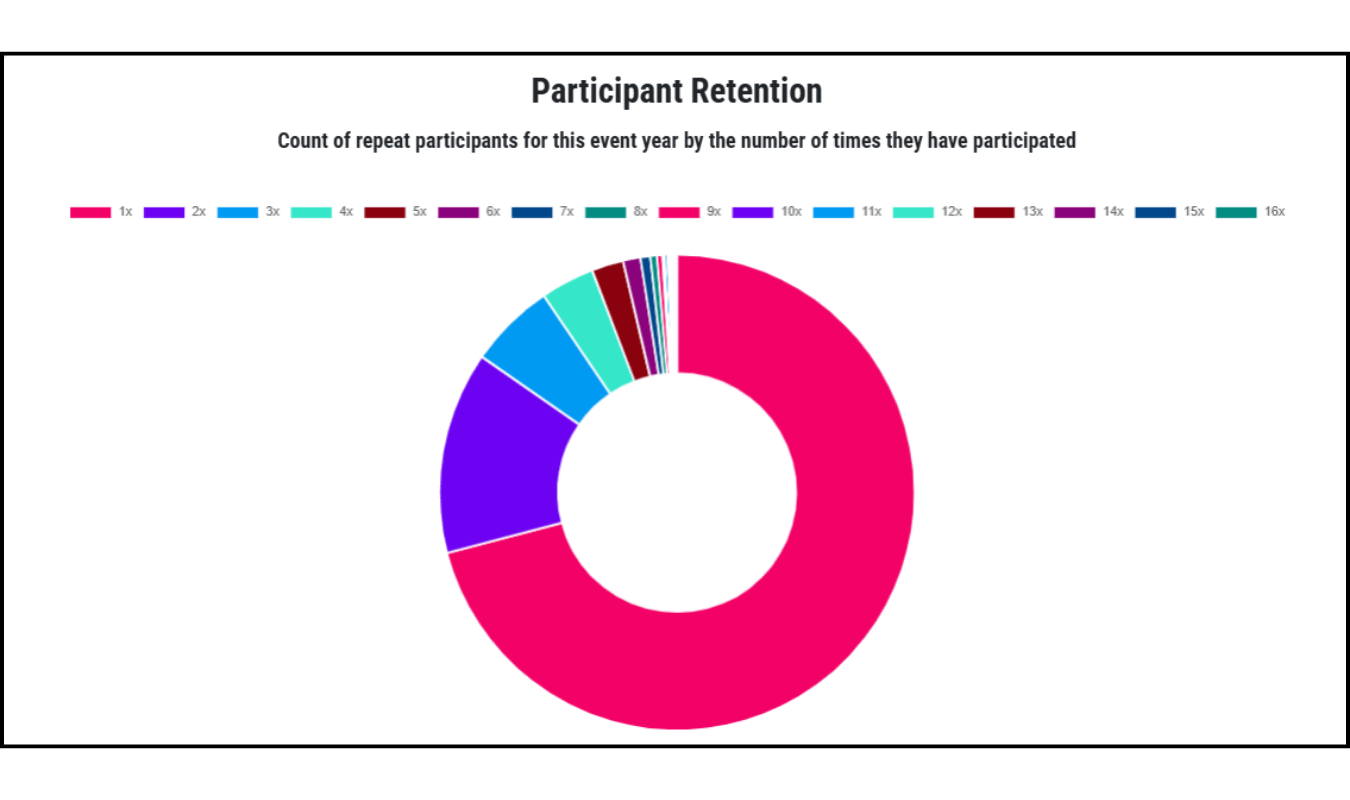
You’ll see what percentage of runners return for two years, three years, and more. You can boost your retention rates with a strong email marketing strategy and a loyalty program. It’s much easier to keep people returning than to find new participants each year, even though the reality is that you have to do both.
3. Revenue by Category
Identify which categories drive the most revenue for your race. It may not be your most expensive category. With this information, you can consider decisions about which categories to keep and even discontinue in future years.
4. Race Year Registration Trends
Use the Race Year Registration Trends report to compare your daily registrations year over year. This data will help you know if you’re behind and need to do more marketing or if you’re ahead of past year’s registration.
You’ll be able to ensure a packed start line by tracking these trends.
5. Race Year Revenue Trends
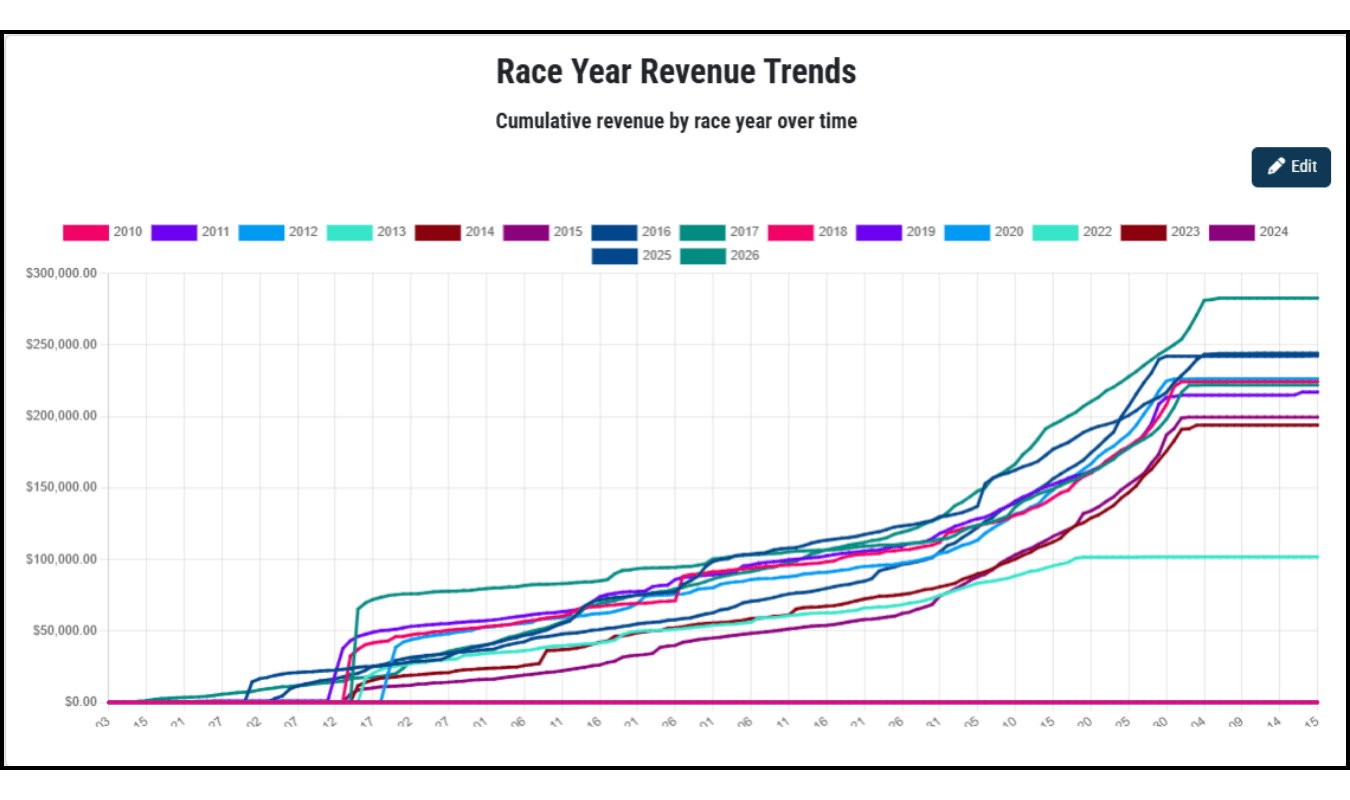
Compare your overall revenue trends year over year with this report. Unlike the Race Year Registration Trends report, the Race Year Revenue Trends report considers all of your revenue sources – sponsors, merchandise, booth sales, and donations. You’ll get a better understanding of your revenue flows, which helps you plan around your cashflow.
6. Yearly Totals by Category
Quickly see your participant numbers for each category by year. This report gives you detailed information about your participant counts, and you can use this report to understand your deferral rate and no show rate to plan better for your race.
7. Yearly Revenue by Category
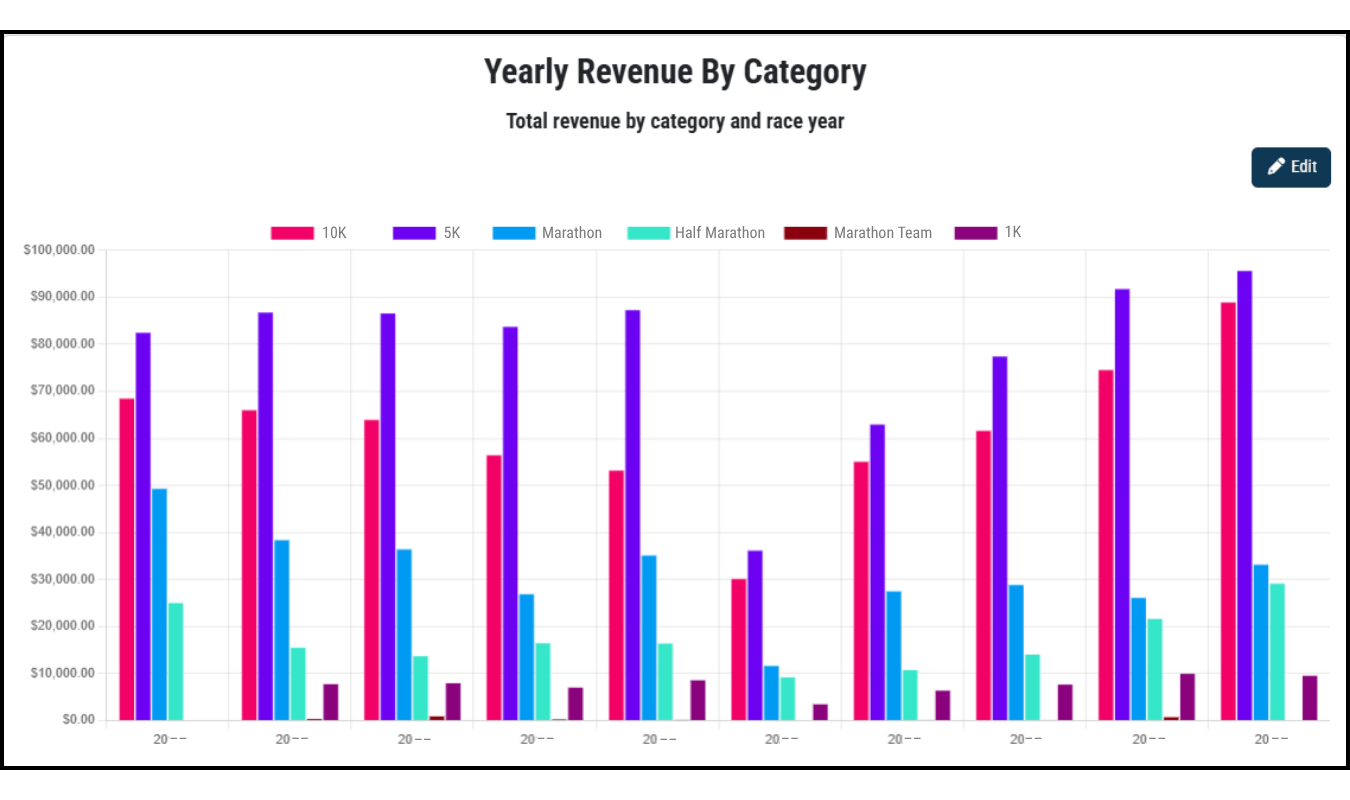
Compare the revenue each of your categories generates year over year to identify your most popular distances and which categories are most valuable to your race.
8. Registration Question Stats
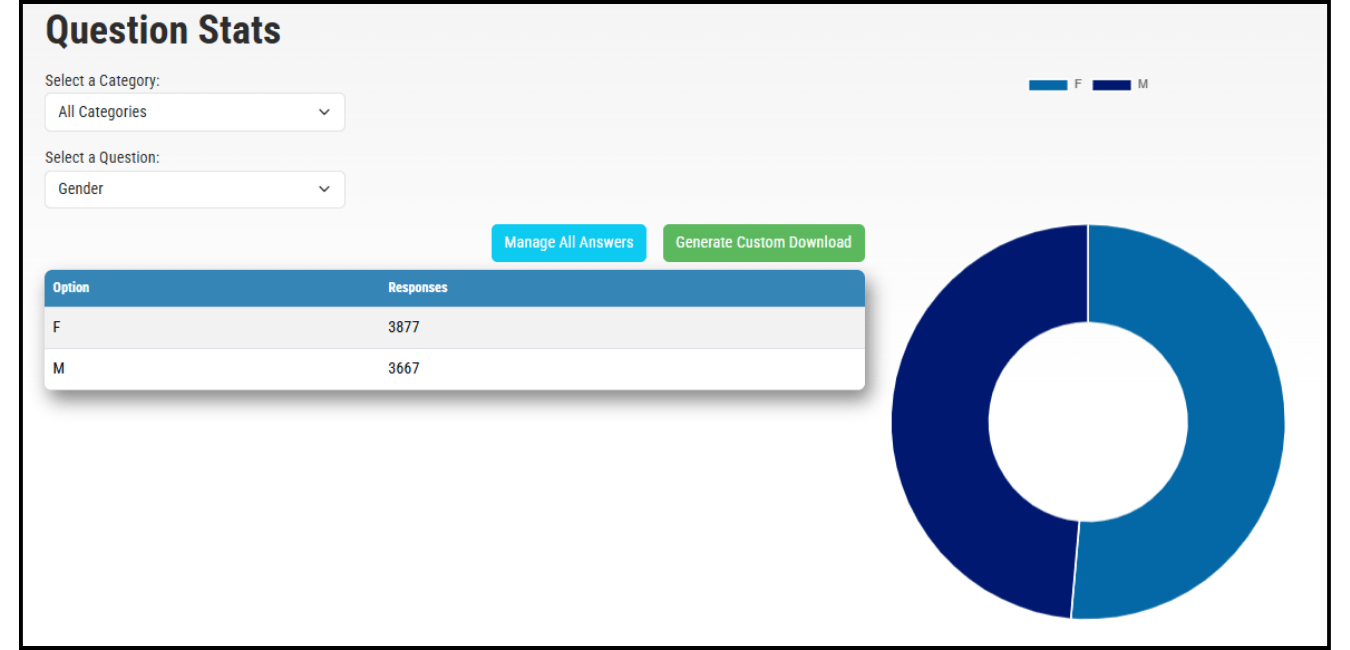
Quickly see overall numbers for shirt sizes and other questions you ask on your registration form. You can see this information in aggregate pre-built summaries or you can download it for your own custom analysis.
Pre-Built Financial Reports for Race Directors
Whether you’re organizing your race as a fundraiser or building a business, everything comes down to the numbers – you at least need to break even, and you want to be profitable. Race Entry offers five pre-built financial reports that help you track your finances in addition to our integration with QuickBooks.
1. Financials & Chargebacks
On your “View Financials” page, you’ll see all of your revenue broken down into each disbursement period. You’ll also see where your revenue comes from and any discounts or refunds you offered so you can have an accurate read on your funds.
From this page, you’re also able to view your chargeback invoices so you can see what we’re fighting on your behalf.
2. Direct Deposit Reports
If you’ve opted for direct deposit, you can select what data you’d like to review and create a custom report.
3. Forecasting
Race Entry’s forecasting tool helps you predict your profitability by viewing your costs and revenue side by side. All revenue processed through Race Entry’s system is automatically tracked – sponsor deals, merchandise sales, vendor booth sales, donations, and registrations.
All you need to do is add your expenses so you know exactly what you need to break even and predict your profitability. You can even do budget analysis to identify your biggest costs and look for smart ways to cut costs.
4. Revenue by Type
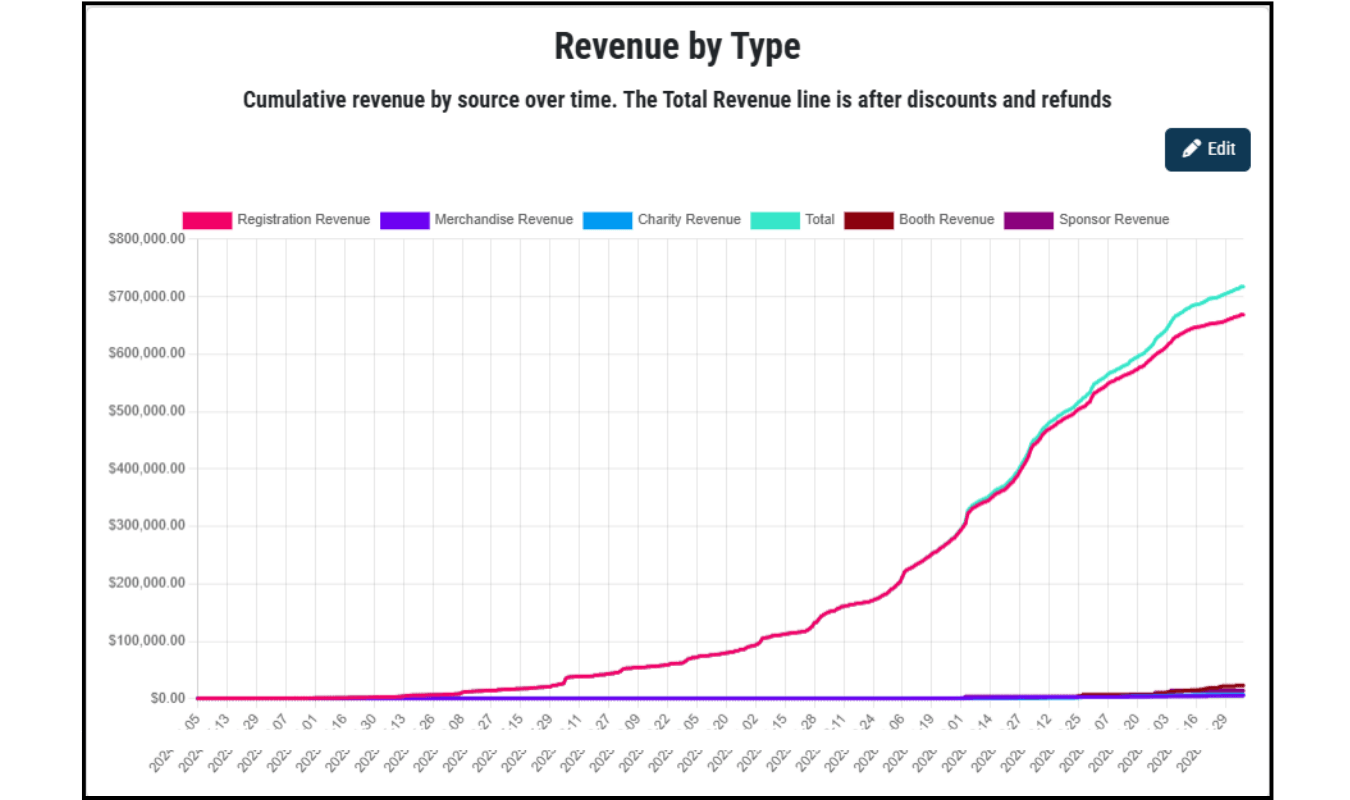
With the revenue by type, you can see how much revenue your race generates from
- registration
- merchandise
- booths
- sponsors
- donations
With this information you can see which revenue source is the most important for your race and identify strategies to grow your weaker revenue sources.
5. Median Order Stats
On your “View Orders” page, you can see quick stats about your median orders – how long does it take someone to checkout online, how many booths or registrations are in an order, and how much revenue does each order represent.
With this information, you can make better strategies with your group discounts, consider featuring merchandise items, and consider including donation requests on your online form to improve these stats.
Pre-Built Booth Reports
When you’re selling expo booths for packet pickup and your finish line festivities, you’ll benefit from understanding your sales trends as you’re working with businesses and brands supporting your race.
1. Booth Heat Map
Like the registration heat map, this report helps you understand where most of your vendors come from.
This information can help you understand how far companies are willing to travel to be at your race to sell their products or connect with your community, which can help you target your sales outreach better.
2. Booth Retention
Get a sense for how many of your vendors come back each year. If your retention rate is high, then your vendors are finding value from your race, and their target market is at your race.
If the number is low, find ways to improve the experience you’re offering your vendors.For example, maybe you need to change your booth map to get more people circulating past more of your vendor booths. Or, maybe you need to make some adjustments on pricing.
3. Revenue by Event Day
If you have more than one opportunity for vendors to have booths, you can track which day is most valuable for your race – packet pickup expo or your finish line festivities. With this information, you can find ways to make your weaker day more valuable or cut it entirely if it’s just not worth the effort.
4. Revenue by Booth Type
If you price booths based on their location or have different prices for packet pickup than for your finish line festivities, you can see which booth types drive the most revenue for your race. With this information, you can adjust your pitch and even remove booth type options that aren’t selling as well.
5. Race Year Booth Trends
With this report, you’ll track how much revenue you generate from booth sales each day and compare sales year over year. You’ll see if you're ahead or behind previous years, which helps you know where to shift your focus to ensure you fill your expo hall.
6. Yearly Totals by Booth Type
Use this report to see the total number of booth sales you made each year. This chart is helpful to review alongside the Race Year Booth Trends and Revenue by Booth Type reports.
7. Yearly Totals by Event Day
You can review how many booths you sold for your packet pickup and your finish line festivities in this convenient chart.
8. Booth Sales Question Stats
Similar to the Registration Question Stats reports, you can review any questions you ask on your booth sales page in aggregate summaries, view individual responses, or download the data for your own custom analysis.
Custom Reports for Race Directors
If you need more information about your race beyond the 20+ pre-built reports, you can create your own custom reports.
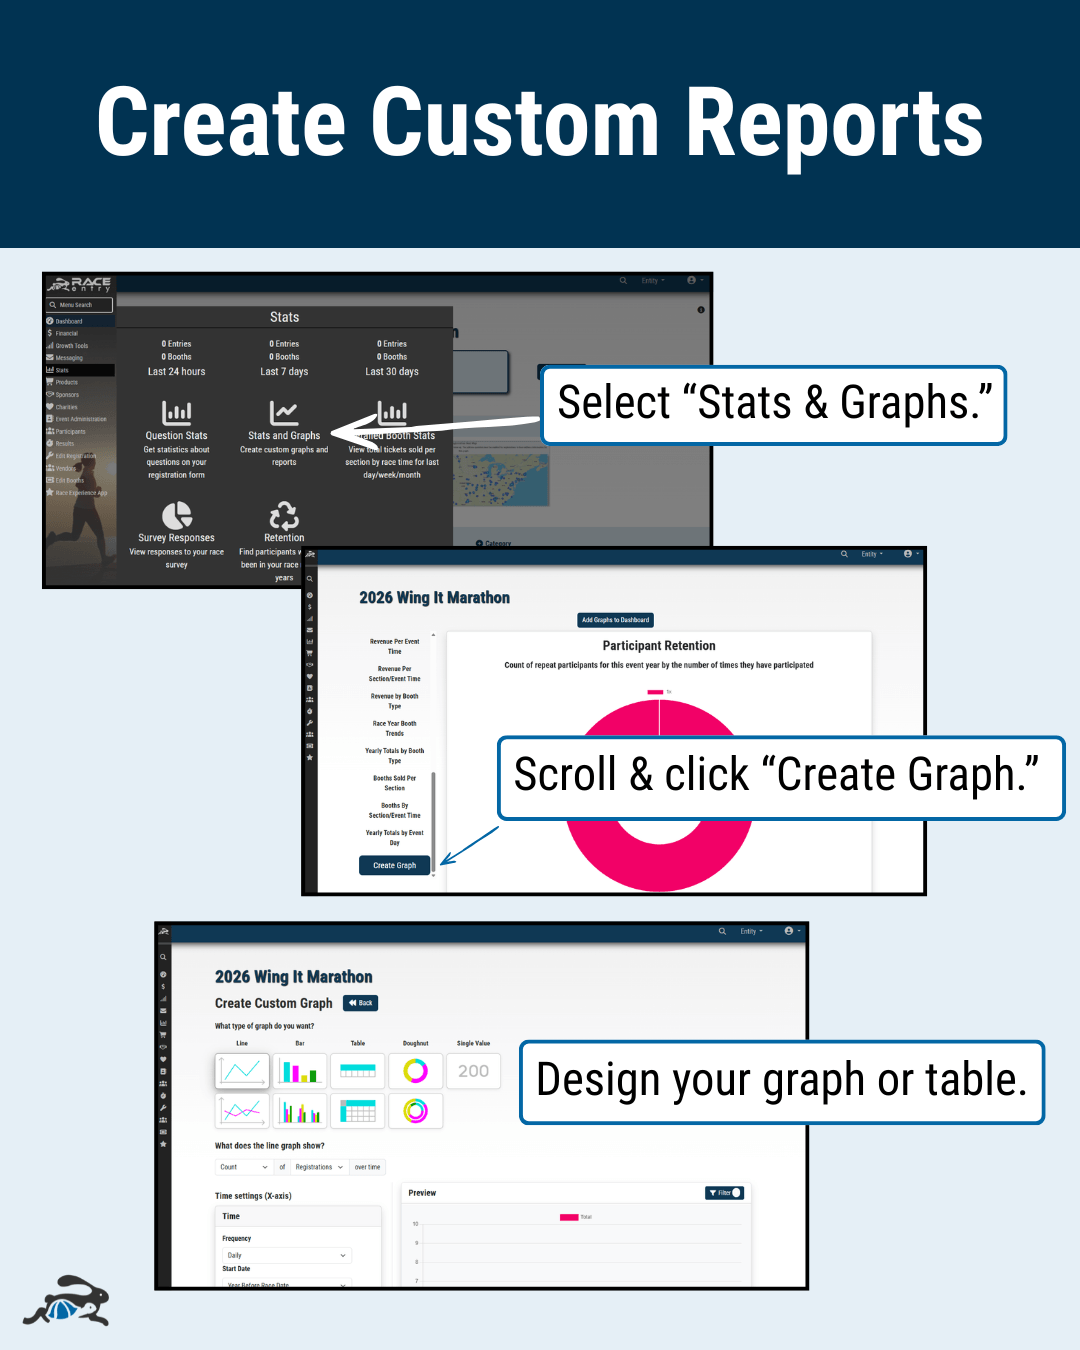
1. Select your graph or report.
Choose the format for your report:
- line graph
- bar graph
- table
- doughnut chart
- single value
To choose the best format, consider the information you need and the easiest way to represent that information.
2. Choose details for your graph or report.
Once you’ve selected your format, next you’ll choose what you’d like the report to show. These options vary depending on the format you’ve chosen.
3. Check filters in preview.
Once you’re happy with your graph settings, you’ll want to check the filters to ensure you’re getting the information you need in your report.
Your data is automatically filtered to show Active orders (completed transactions). If you’re interested in Incomplete orders, you’ll need to change your filters.
You can get even more detailed with your filters – deleted orders, transferred out, etc.
4. Name and save your graph or report.
Once you’re happy with your report, give it a name and save it.
5. View your new graph or report on your graphs page.
Now, you’ll see your new report at the top of your report menu under “Custom”.